Further Project Customisation
In this tutorial you will learn how to further customise your Mergin Maps project from the previous tutorial, making it even more useful. The various changes we will make to the project will be made in QGIS and their effect observed and tested in Mergin Maps mobile app.
The topics covered here are:
TIP
Previous tutorials already covered the minimum concepts for data collection so feel free to skip ahead to the Working Collaboratively tutorial (and come back here later on) if you're super keen on collecting data right away.
Opening the project in QGIS
If you already have the trees-and-hedges project open in QGIS, skip to Layer styles.
Open QGIS
Expand the Mergin Maps entry in the Browser panel to show projects in your workspace:
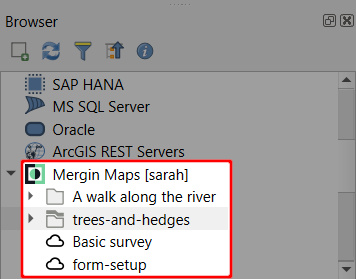
TIP
If you have access to multiple workspaces, you may need to switch to the appropriate workspace in the QGIS browser to open your project.
Locate the
trees-and-hedgesprojectRight-click it and select Open QGIS project:
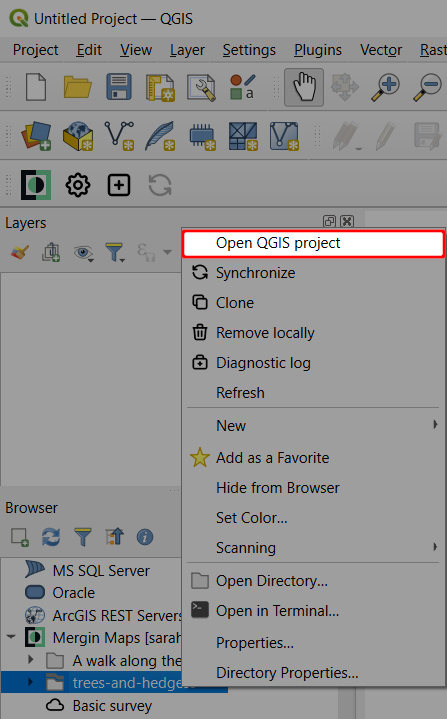
The project should now be loaded in QGIS. Don't worry if you cannot see the features you surveyed in the field - this is probably because you've not yet synchronised the project in QGIS.
If this is the case, click on the Synchronise icon from the Mergin Maps QGIS plugin toolbar to synchronise the changes 
Layer styles
When using the mobile app in the field in the last tutorial, we noticed hedges were difficult to see against the background maps. We'll now fix that.
Double-click the
hedgeslayer in QGIS to open its Layer properties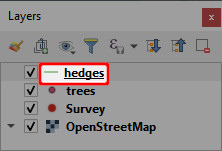
Select the Symbology tab on the left and click the current colour to change it:
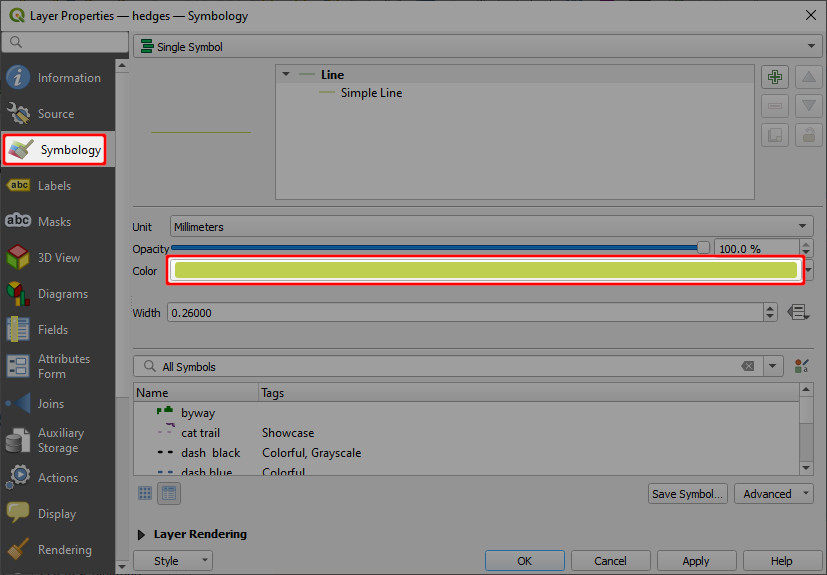
Pick a new colour for hedges which stands out better
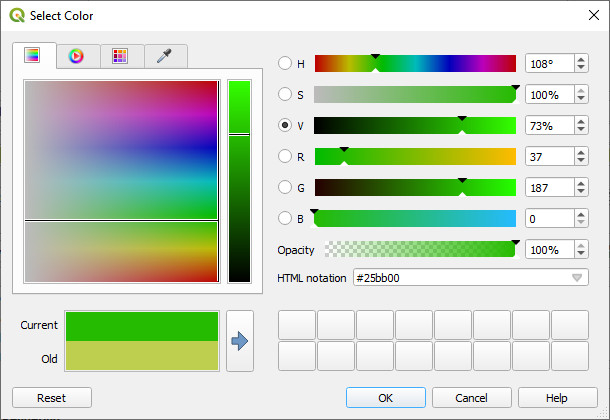
Click OK
Increase the line width to 0.46mm and click OK
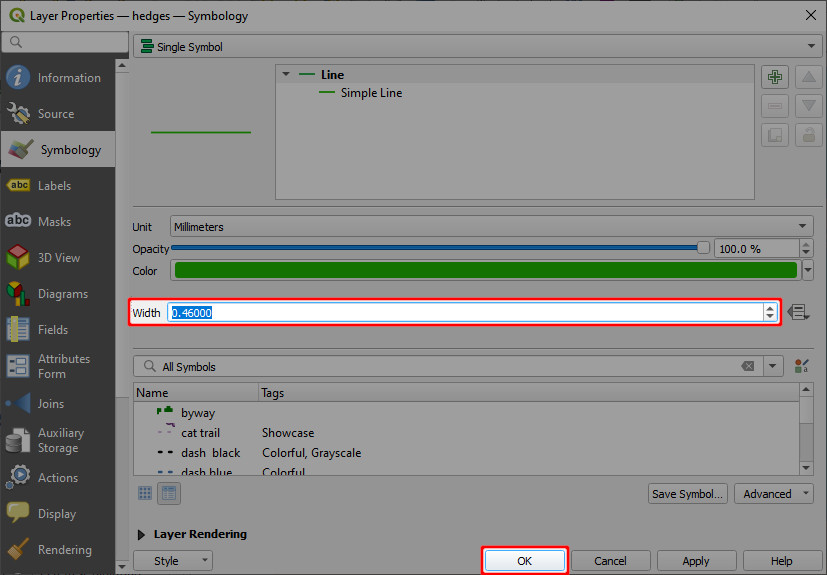
Lines in the hedges layer should now be drawn thicker and in a more prominent colour.
In the next section we'll see what these changes look like in the mobile app.
Trialling changes in Mergin Maps mobile app
Seeing how the changes look like in the mobile app is easy:
In QGIS, save your project:
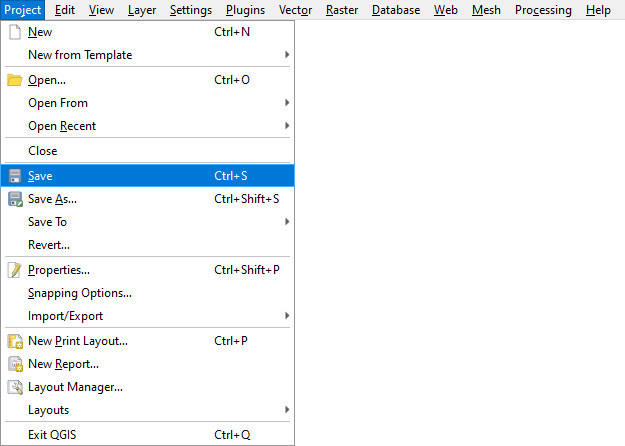
Use the Synchronise Mergin Maps Project button:

The Project status window will open with the overview of local changes. Click Sync to synchronise the project:
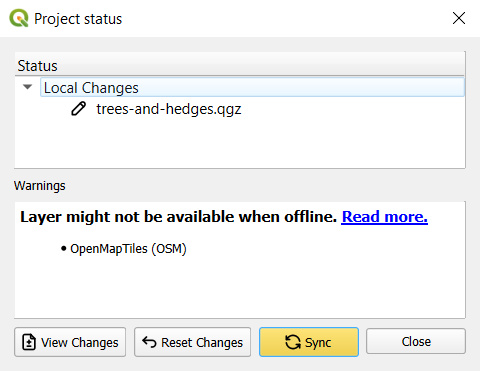
QGIS and your project in the cloud should now be synchronised.

Open the mobile app on your mobile device
On the Home tab, you should see that the
trees-and-hedgesproject has Pending changes to synchronise.Tap on the button next to the name of the project and Synchronise project.
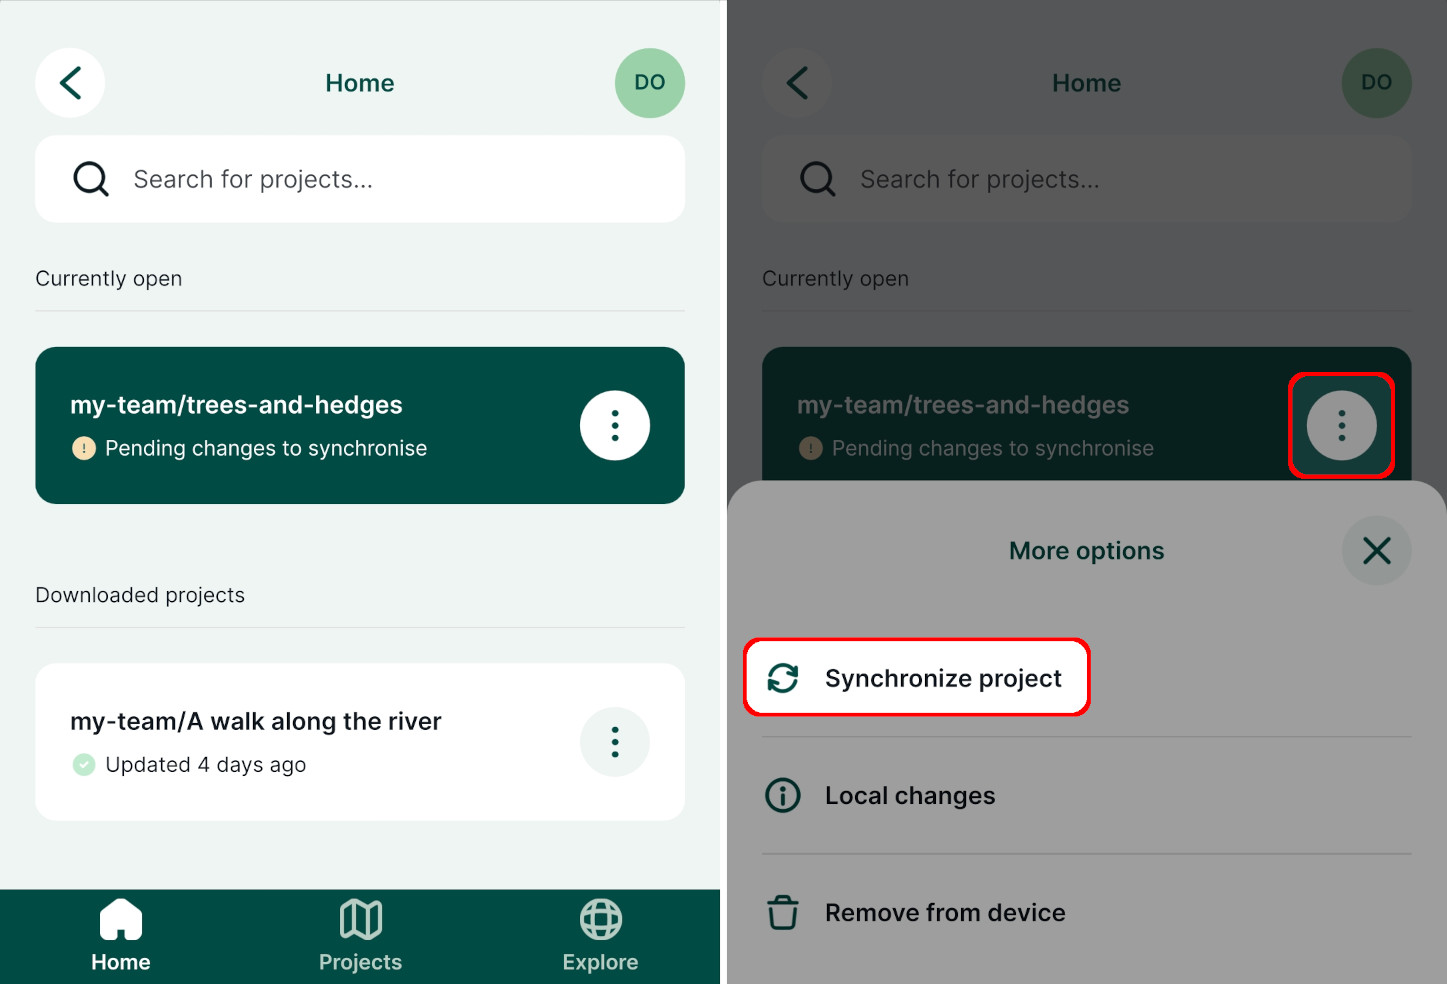
TIP
If you do not see the Pending changes to synchronise message, switch to the Projects tab and back to the Home tab. This should force the mobile app to check again for project updates.
Tap the project to open it.
The surveyed hedges should now be displayed in the style we set up in the last section.
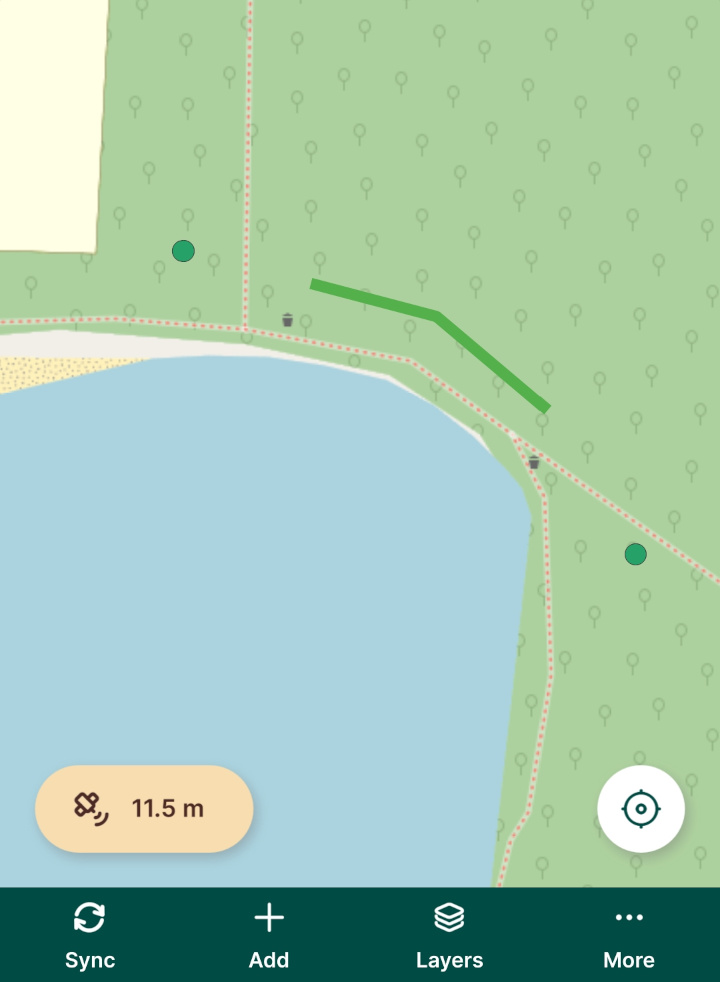
Labels
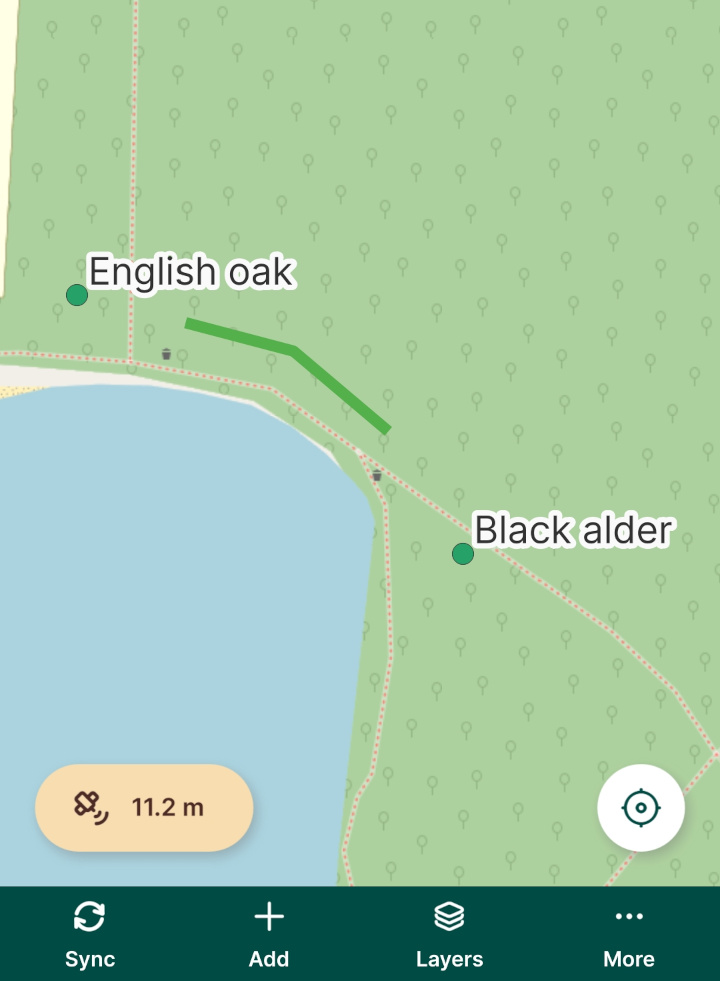
Labels can be useful for showing attribute data or other information directly on the map. We'll now add labels to the trees layer so we can see tree species without having to open each tree's attributes: 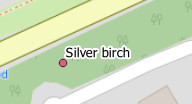
Double-click the
treeslayer in QGIS: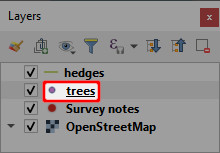
Its layer properties dialog should appear.
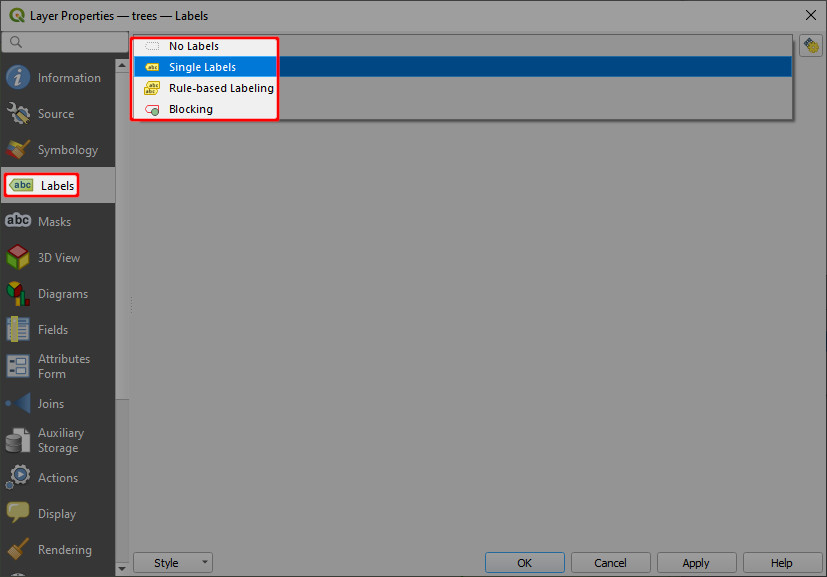
Select the Labels tab on the left hand side
Set the labelling mode to Single Labels:
Set the Value to the
speciesattribute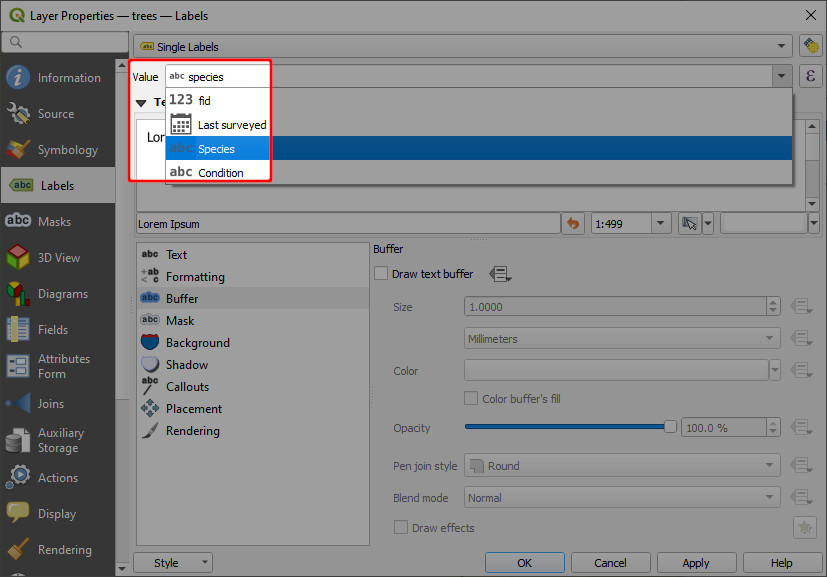
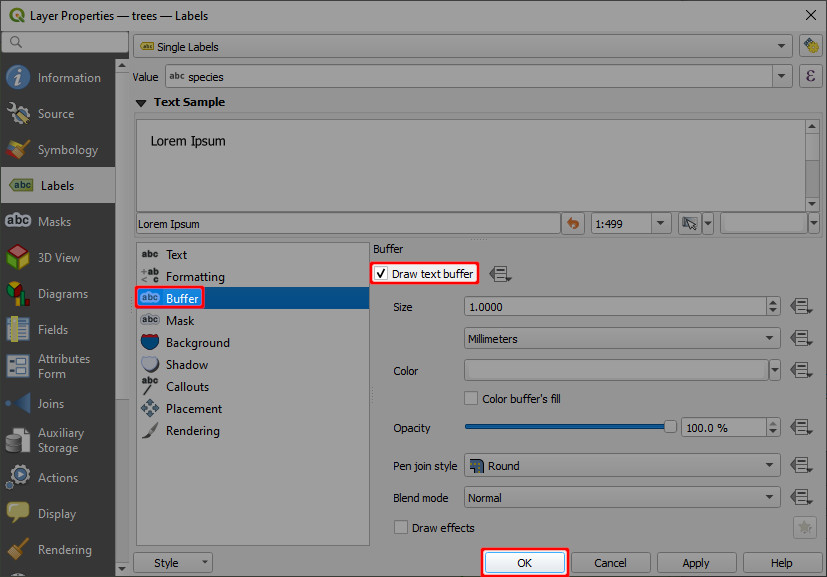
Enable Draw text buffer under Buffer settings and click OK
Test out these settings in the mobile app as described in the Trialling changes section above.
Customising the preview panel
We will now learn how to control the content of the preview panel which is shown when you tap a feature in the mobile app.
The panel for the trees layer looks like the left-hand image below. We will configure it to look like the right-hand image. 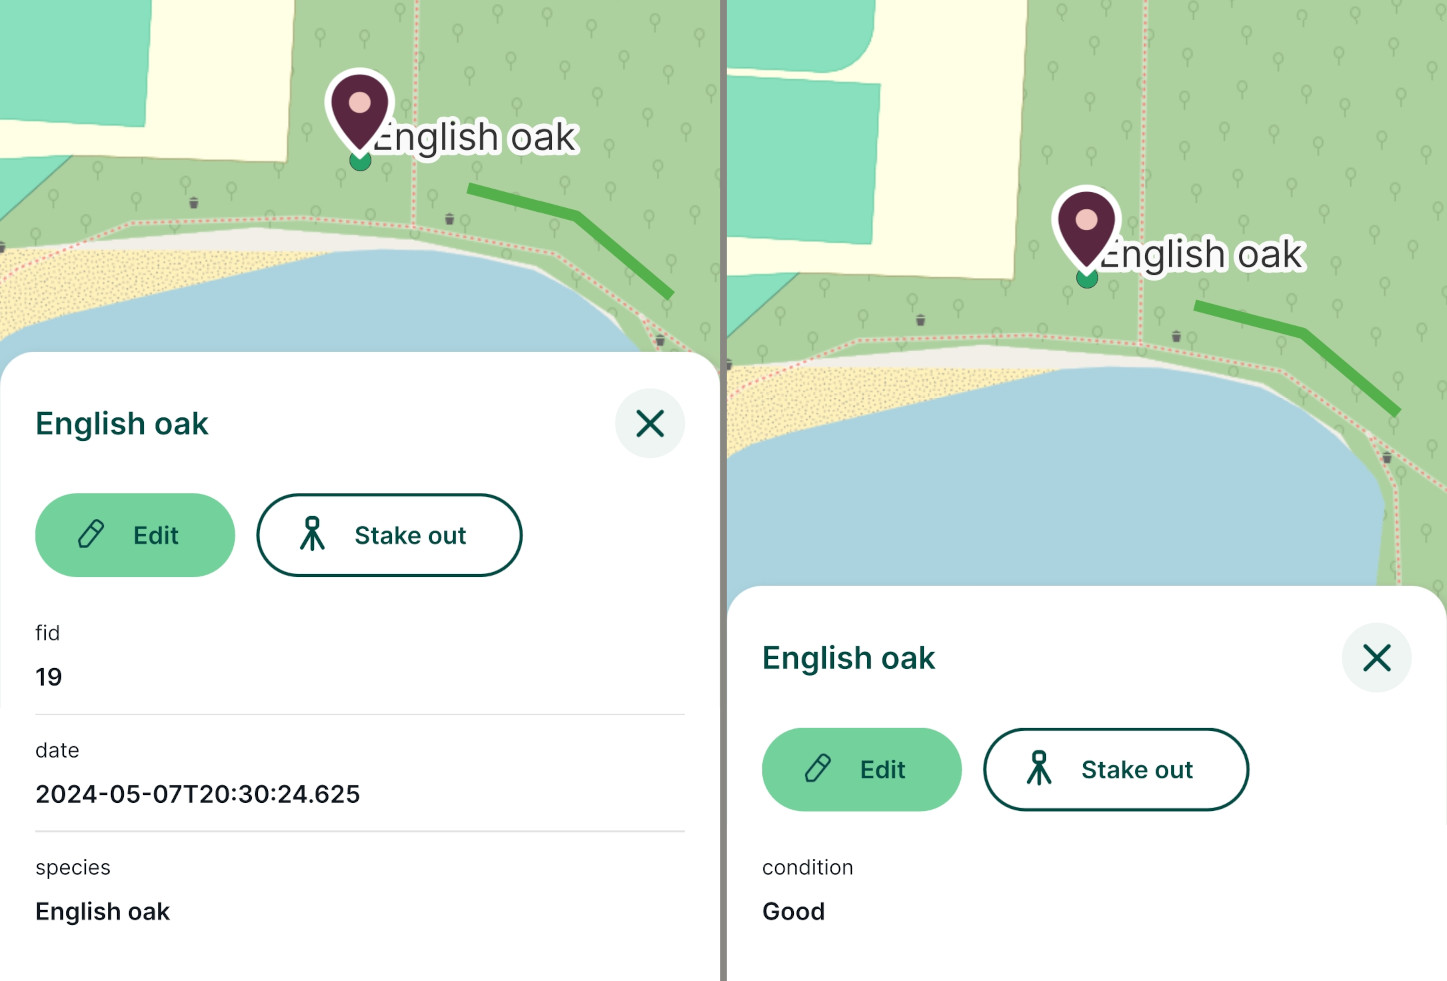
Double-click the trees layer in QGIS:

Its layer properties dialog should appear.
Select the Display tab on the left hand side
Set the Display Name to
species: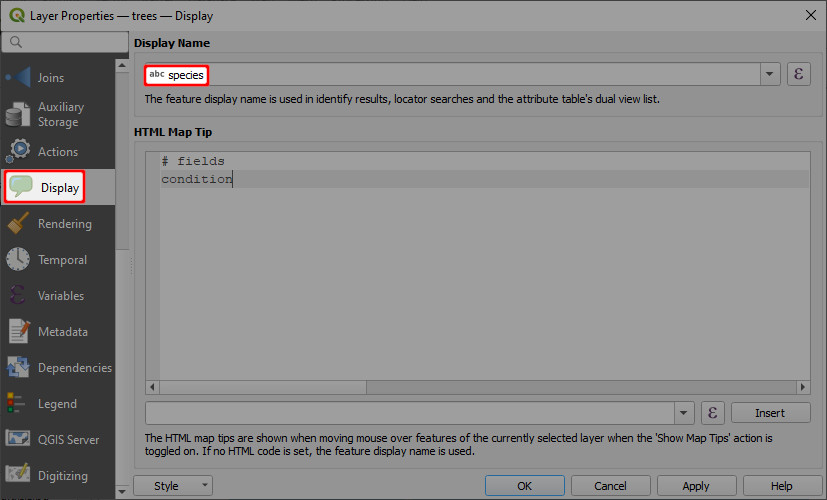
TIP
If you notice subtle differences in the name / spelling of the field when you select it in the drop-down list, this is due to the field having been aliased.
Set the HTML map tip to:
# fields
condition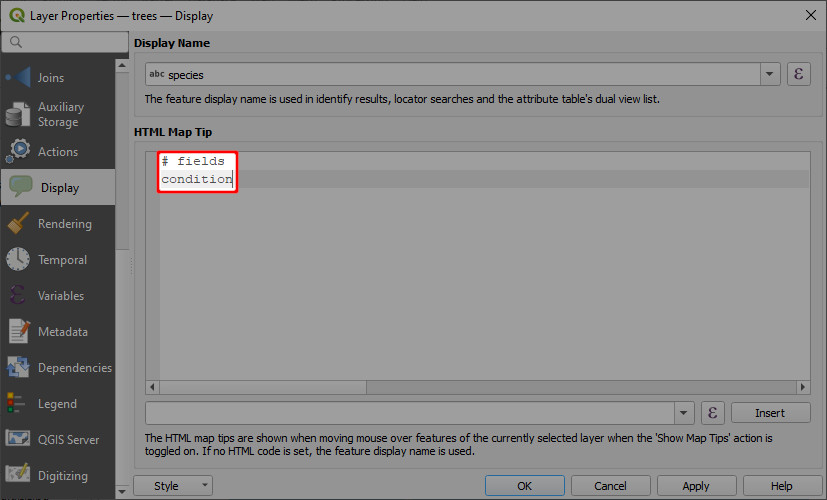
Click OK
Test out these settings in the mobile app as described in the Trialling changes section above.
Controlling layer visibility
You might want to turn off some layers in the mobile app, e.g. when working with overlaying layers or to change the background map.
There are two ways how to change the layer visibility:
- directly in the mobile app
- setting map themes in QGIS
Layers in Mergin Maps mobile app
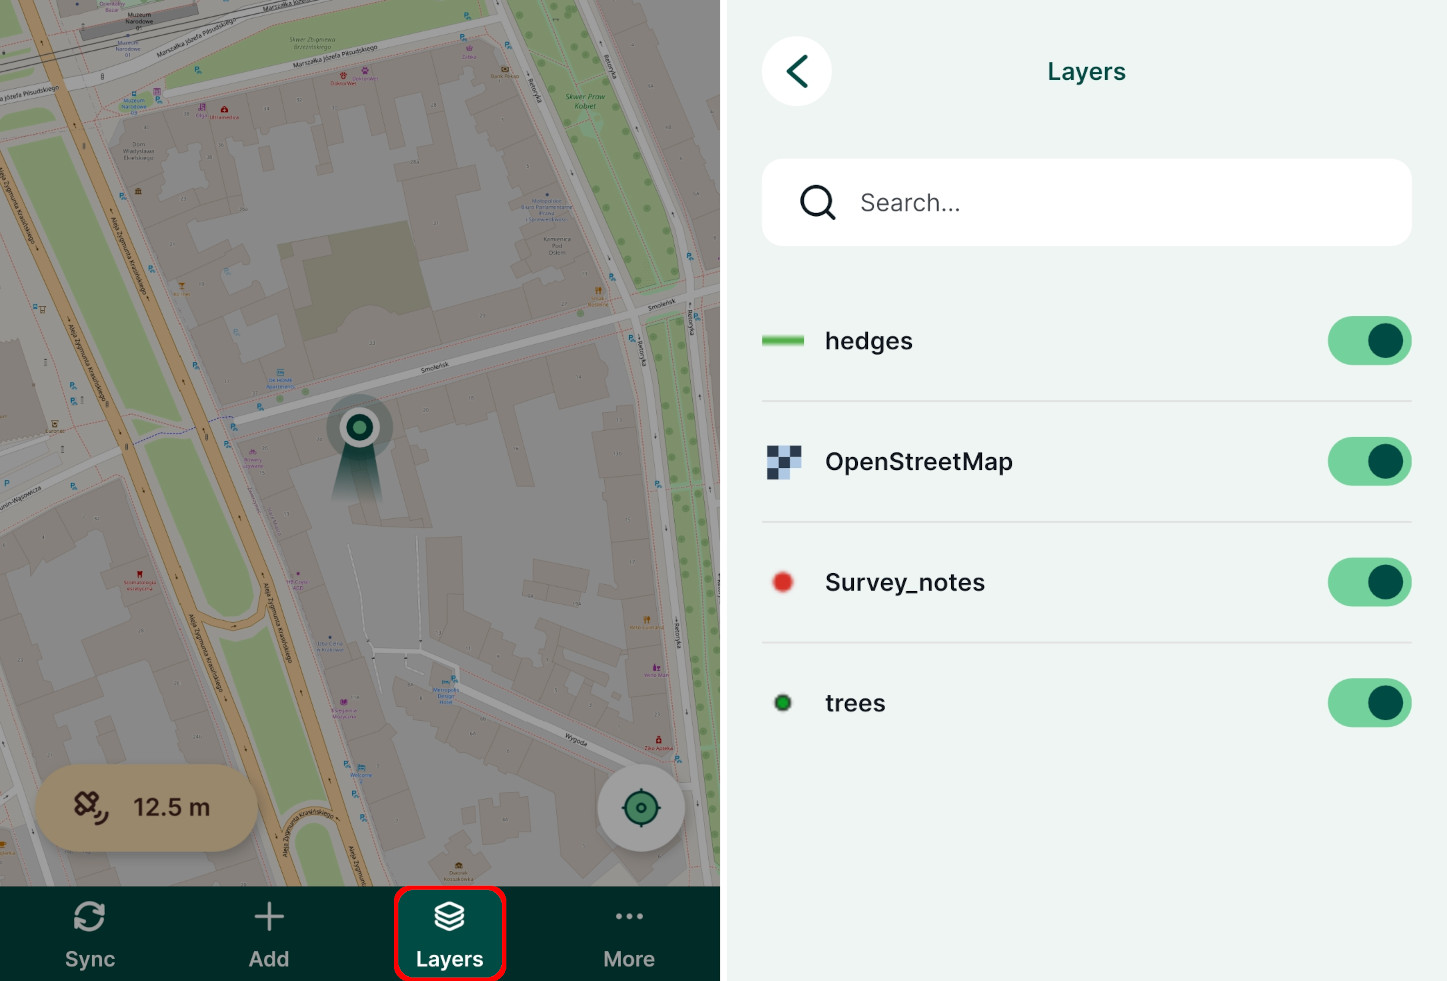
To control the visibility of layers in the mobile app, tap the Layers button to see the list of layers in the project.
Toggle the button next to layer's name to turn it on or off.
Map themes
While the visibility of single layers can be controlled easily in the mobile app, it might be useful to set up map themes in QGIS. A map theme defines which layers will be displayed, so you can define useful combinations of layers and background maps and switch between them in the mobile app.
Here we'll define the following map themes:
- All layers includes all map layers
- Hedges contains just the
hedgeslayer and the background map
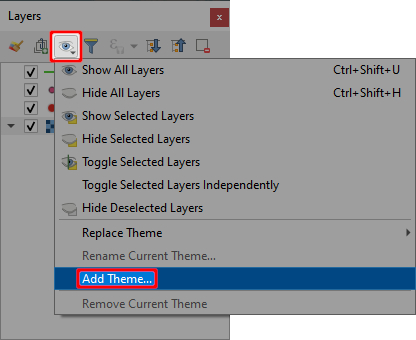
In QGIS, click the Manage Map Themes button and select Add Theme...:
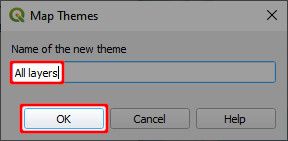
Call the theme All layers and click OK
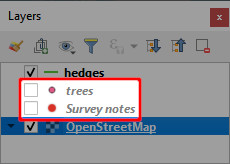
Uncheck the trees and Survey notes layers:
Add another theme like in step 1, calling it Hedges and click OK:
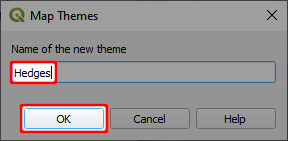
Switching between the two themes in QGIS causes the layer visibility to be updated accordingly.
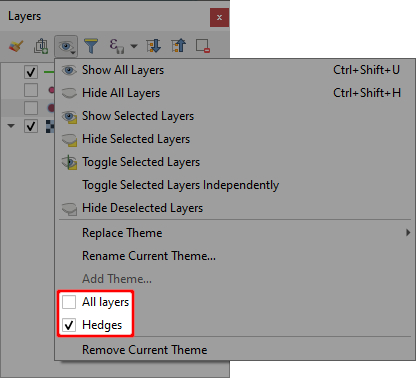
The themes have now been created. Don't forget to save and sync your project!
Test out these settings in the mobile app as described in the Trialling changes section above
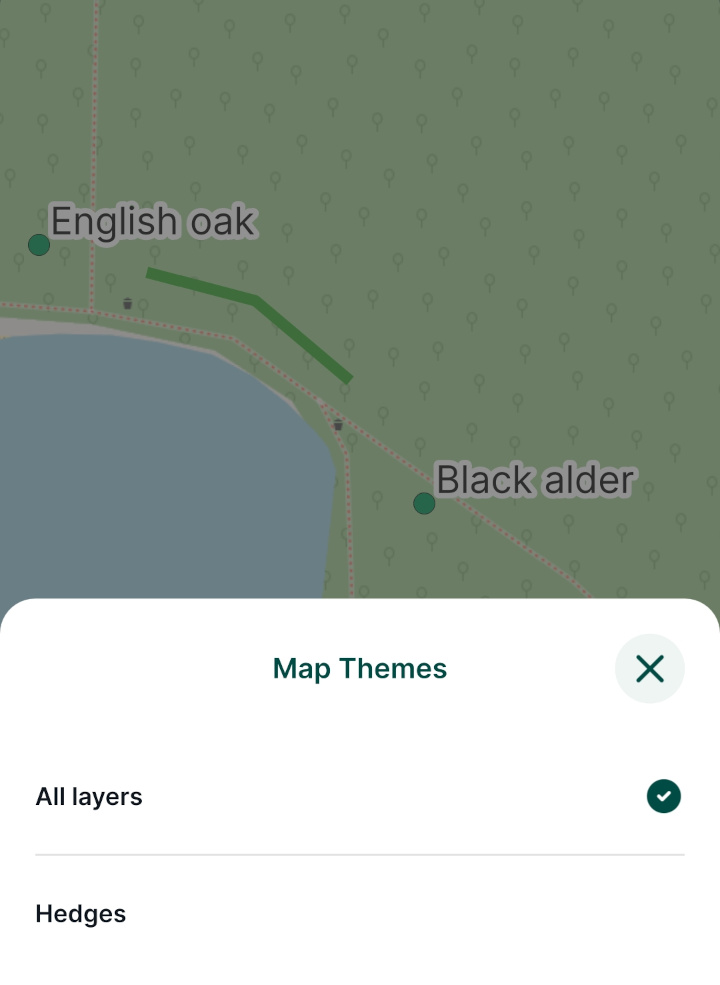
Map themes can be accessed in the mobile app from the More menu:
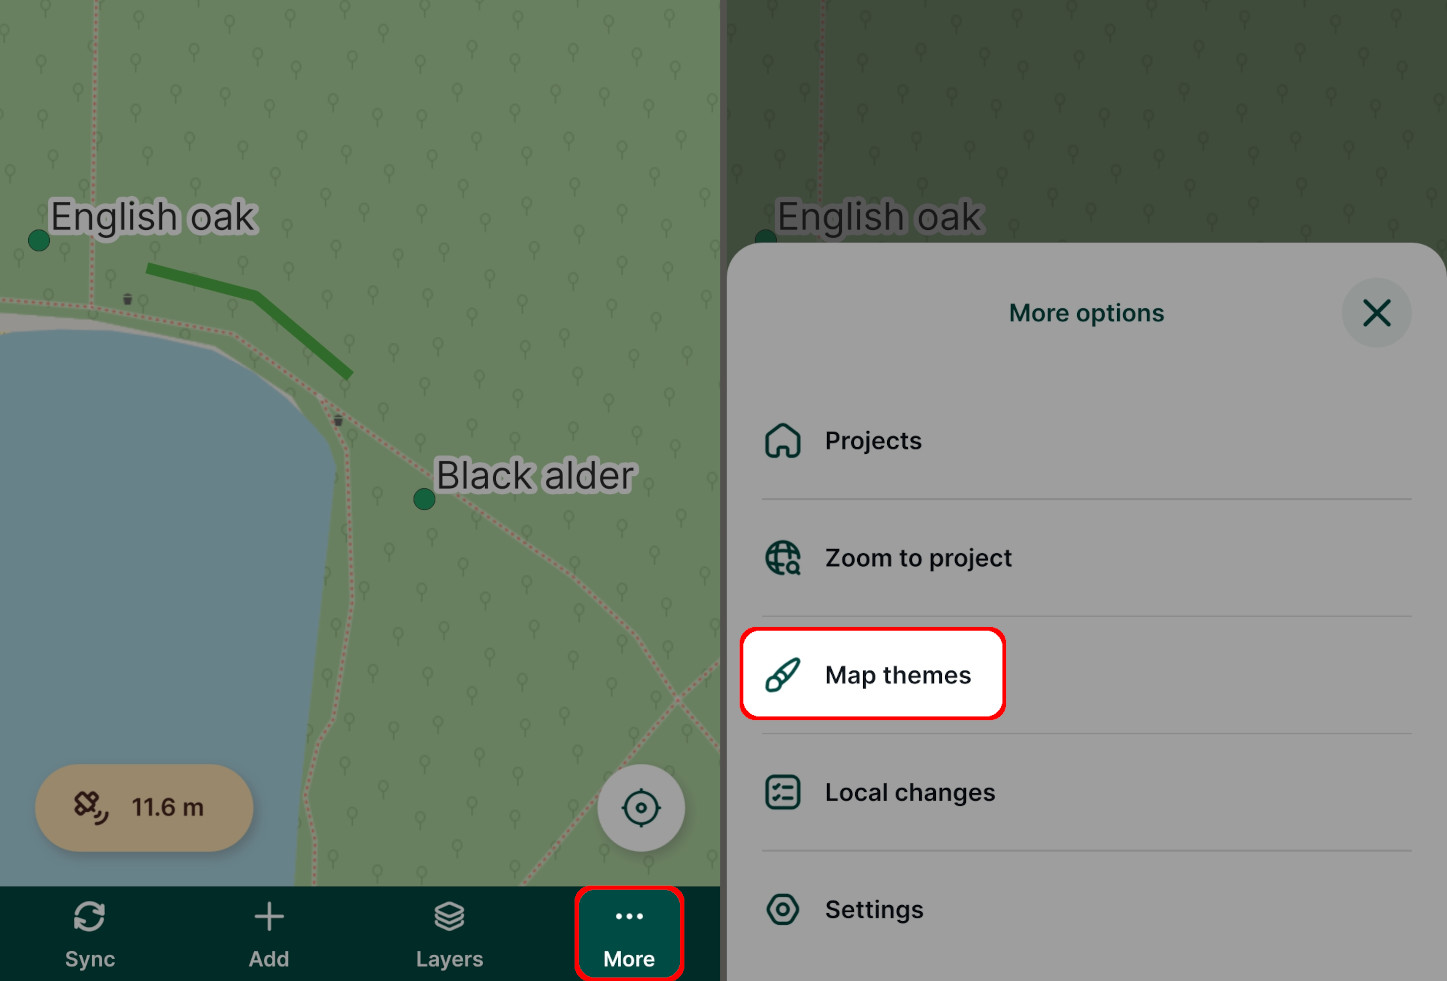
Simply switch between map themes in your project by tapping the one you want to use.
Zoom to project extent
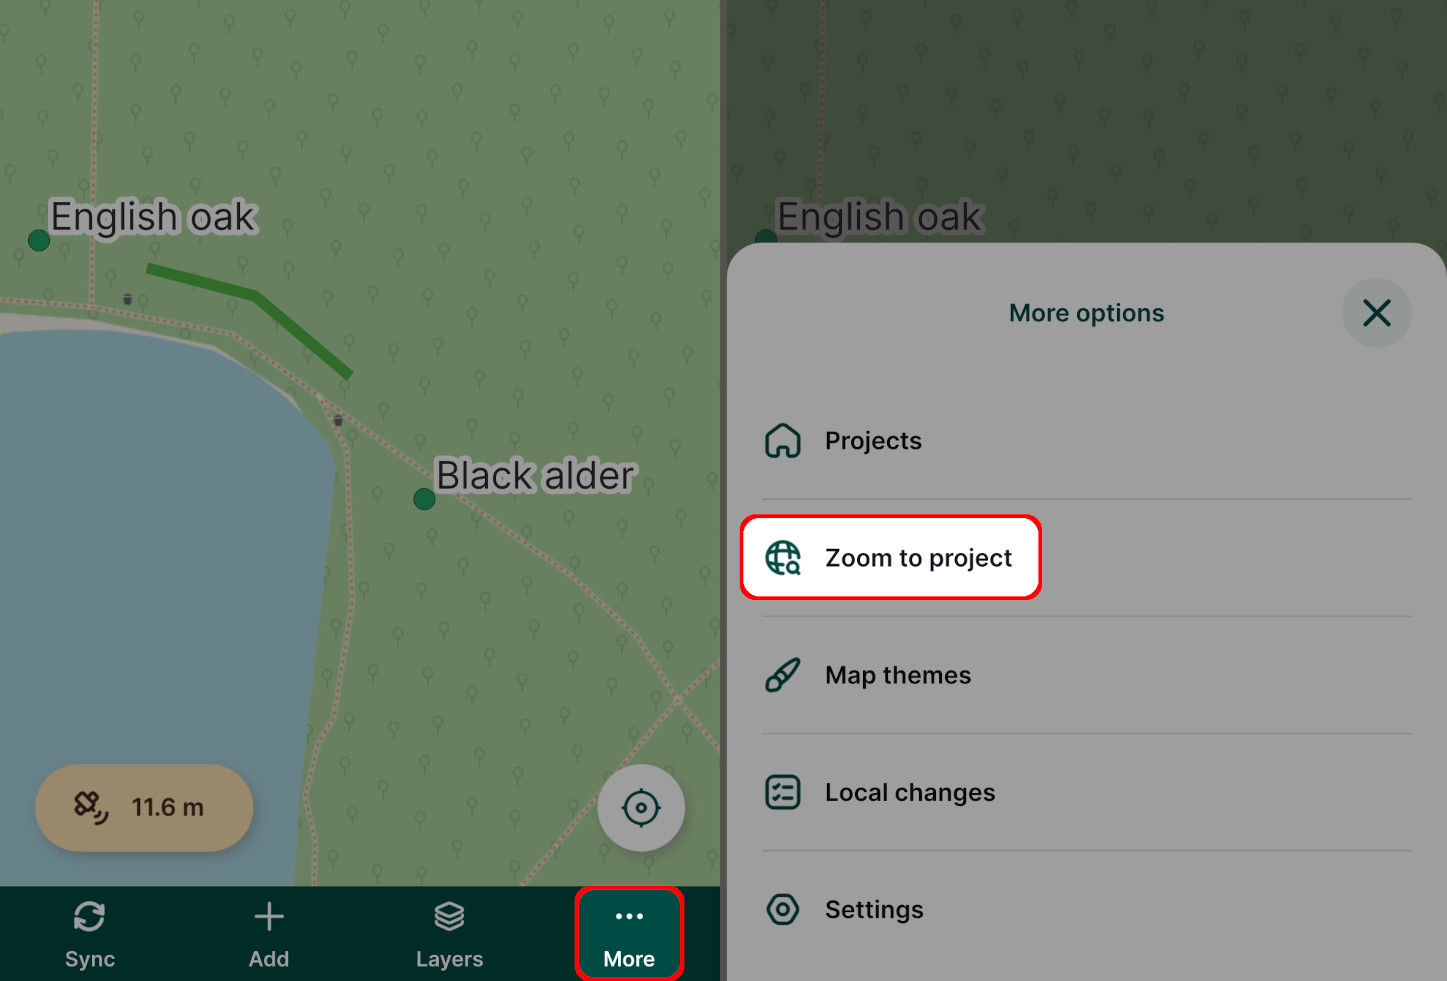
If you experimented with the Zoom to project button in the mobile app you'll have seen that by default, it zooms to the extent of the somewhat large background map:
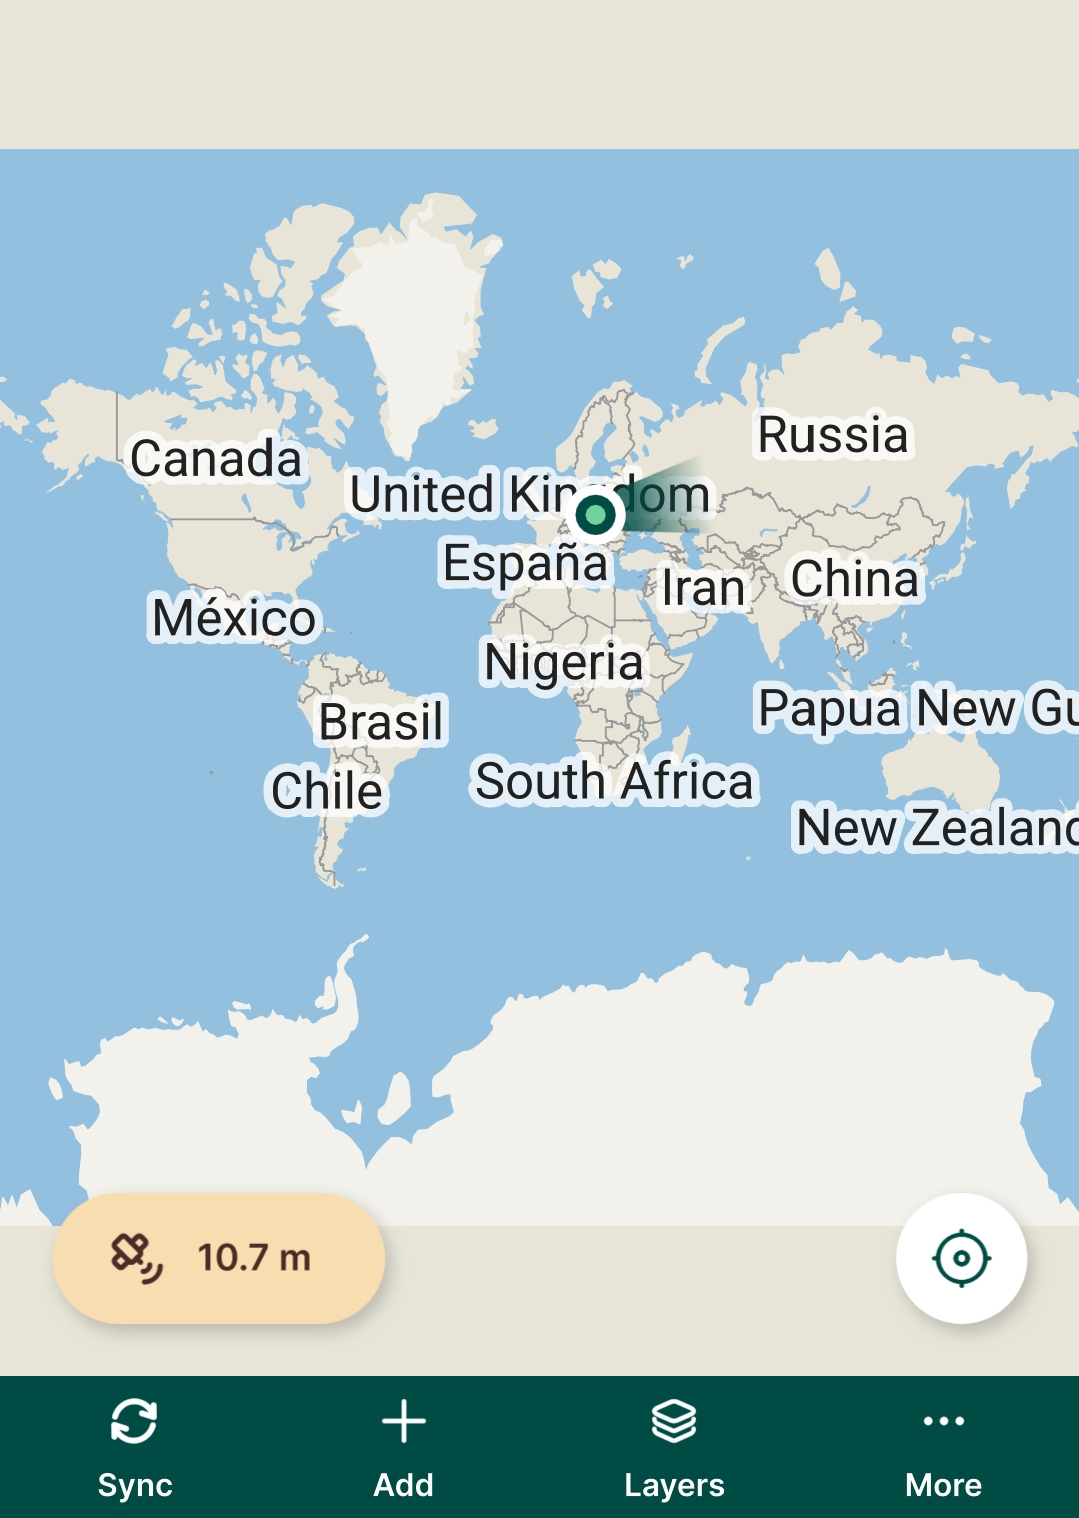
This is not very useful so we will learn how to specify the extent that this button will zoom to.
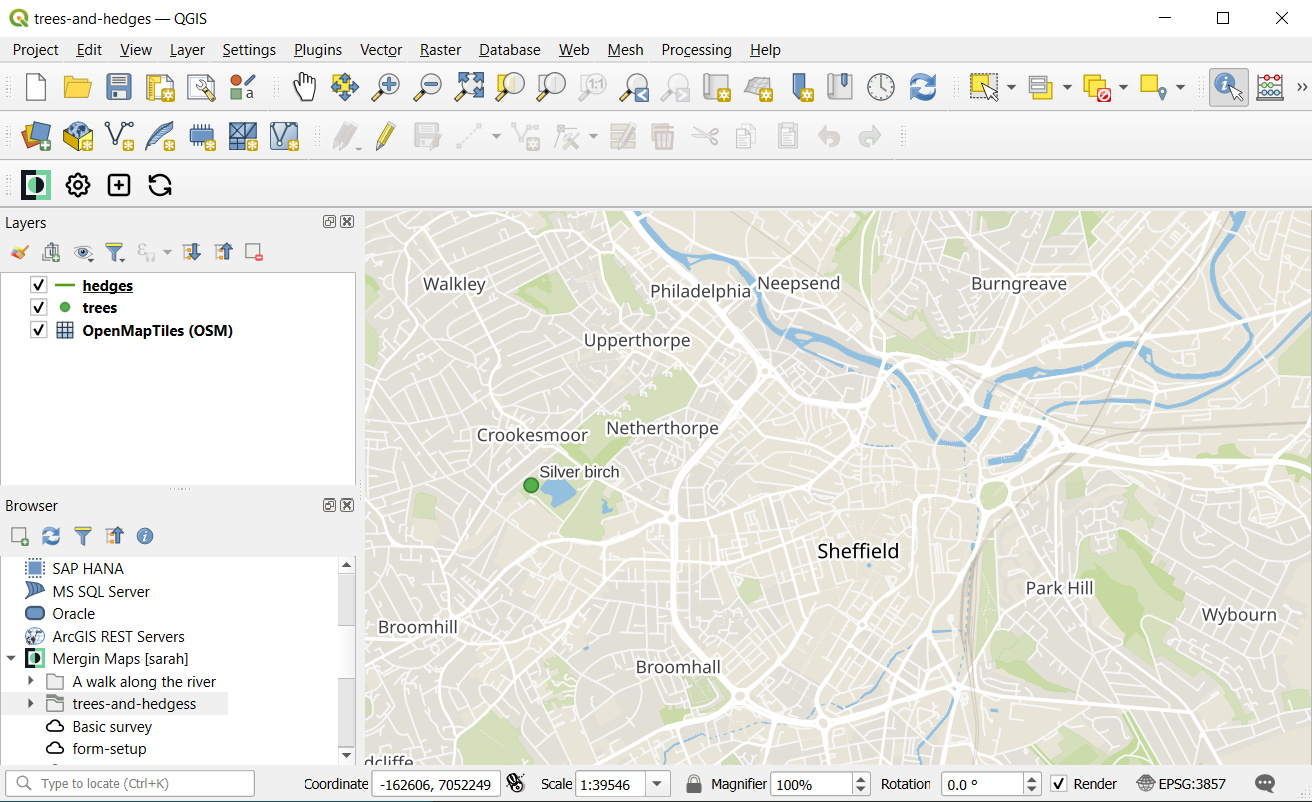
In QGIS, zoom / pan the map to your desired default extent:
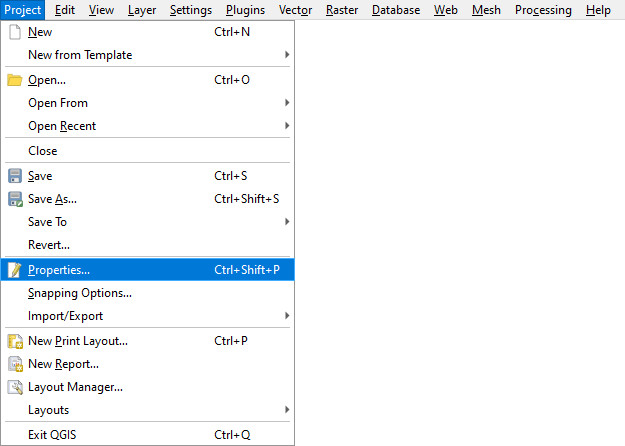
Select Project > Properties...
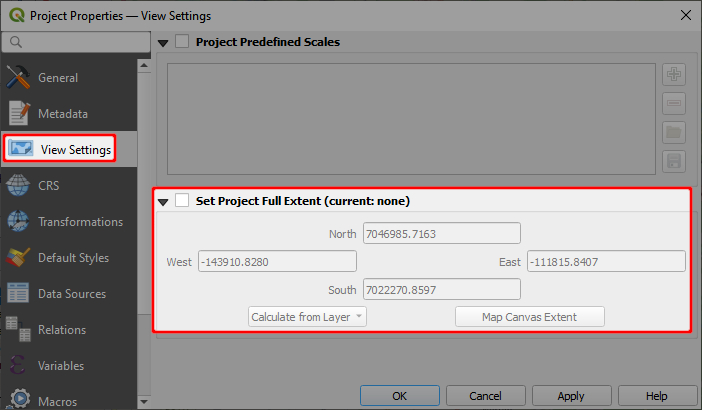
Select the View Settings tab
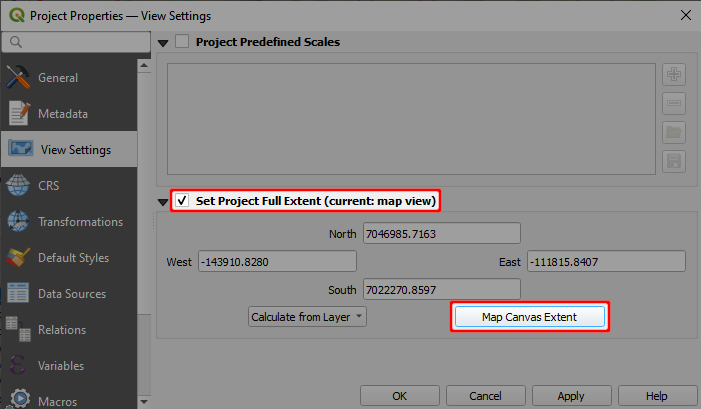
Check Set Project Full Extent
Click Map Canvas Extent:
Click OK
Test out these settings in the mobile app as described in the Trialling changes section above
The Zoom to project button can be found in the mobile app by tapping the More button:
Learning more
The aim of this tutorial was to introduce you to the main concepts of customising Mergin Maps projects in QGIS and to cover common customisation workflows in a basic way.
You will find more tips on how to prepare your QGIS project in Setup GIS Project.