


EDI Environmental Dynamics Inc. (EDI), has more than 30 years of history of environmental consulting across northern and western Canada, where around 180 staff members collect data on remote sites, along riverbanks reachable only by helicopter, and in places where the nearest internet connection is a satellite dish. It is demanding work, and the tooling behind it has to keep up. We are proud that Mergin Maps is at their frontline.
From our discussion with Logan Thideman, IT Director with a 13-year tenure, it was hard to pinpoint the one element that would highlight most impressively the level of adoption and utility of Mergin Maps in their workflow and projects. The fact that they have almost 100 active consulting projects in their dashboard using Mergin Maps is a good candidate. That these files amount to more than 200 gigabytes in total is another. But our pick ends up being this: throughout the 42-minute interview, Logan showcased a deep knowledge of the Mergin Maps ecosystem, its capabilities, its history, and even its average update frequency.
Migrating to Mergin Maps: From a patchwork of apps to a fully featured, open-source solution
EDI was already well-established before QGIS even came out, let alone Mergin Maps, so it’s only natural that they have tried numerous other solutions for navigation, field data collection and data management. Over the years, they ran into all sorts of obstacles: constant app-switching between navigation and forms, data trapped on devices, expensive licenses and shady credit systems that made project scoping unpredictable. All of that prompted their team to search for a better alternative and they came across Mergin Maps through a QGIS Reddit thread.
The transparency of open-source came up repeatedly as a reason for the decision to trial Mergin Maps for a year. Mergin Maps is open-source; everything is on GitHub and the code is accessible. This way, the active development pace is also visible, thus establishing a trustworthy track record for the app. Feature-wise, the history panel and geodiff make it very easy to self-diagnose problems, which is incredibly useful for the teams who can be out working any day of the week and cannot wait over a weekend for vendor support. And the continuity of the QGIS interface makes it all easier, as it ensures that what you built on the desktop is what you see in the field: same symbology, same folder structure.
Wiring Mergin Maps with other apps to set the standard for environmental consultancy services
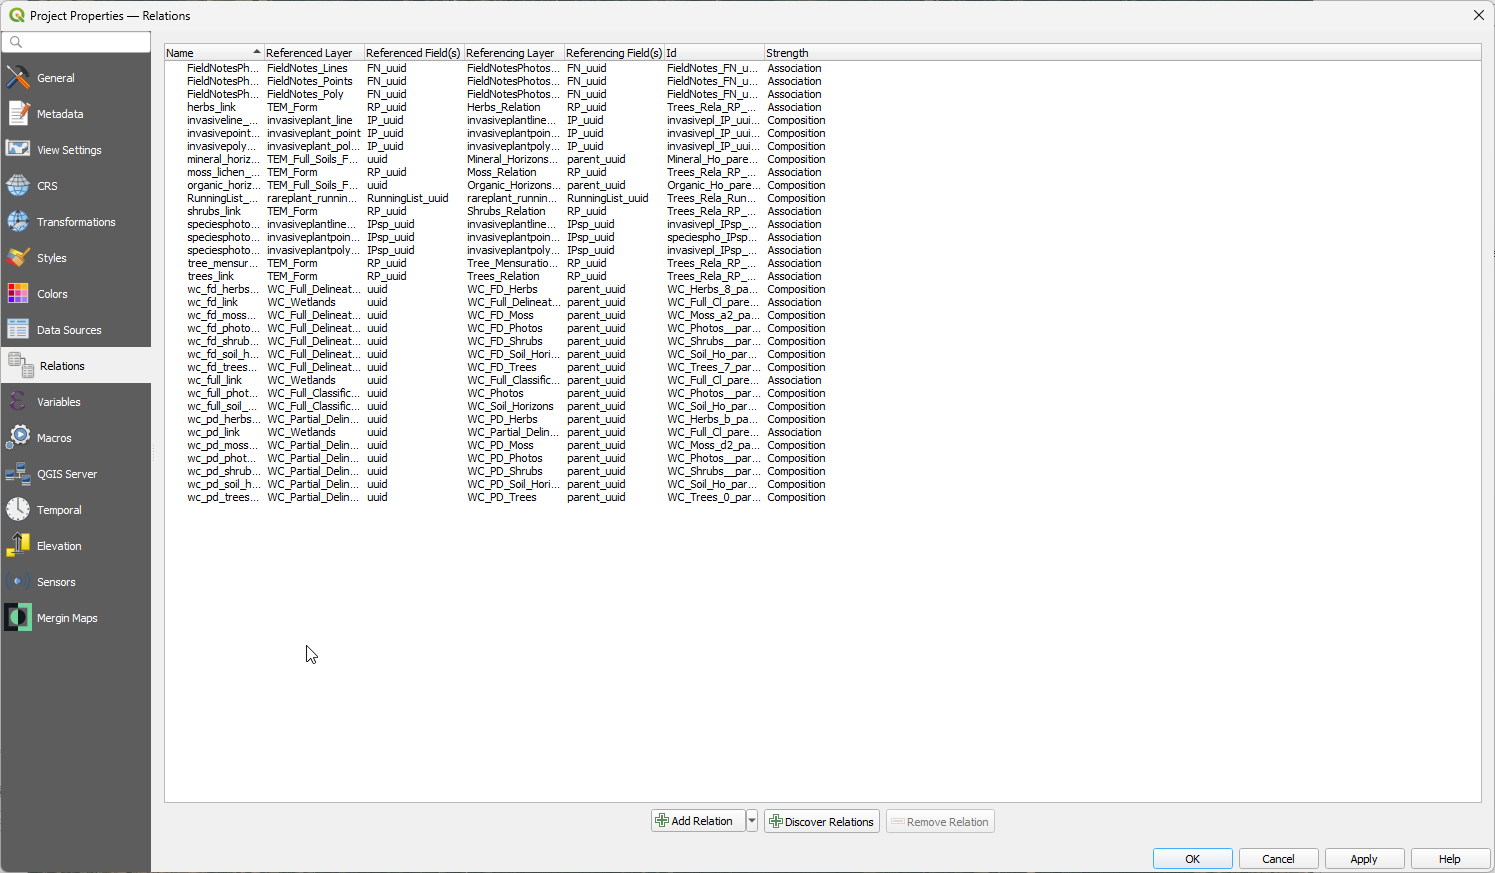
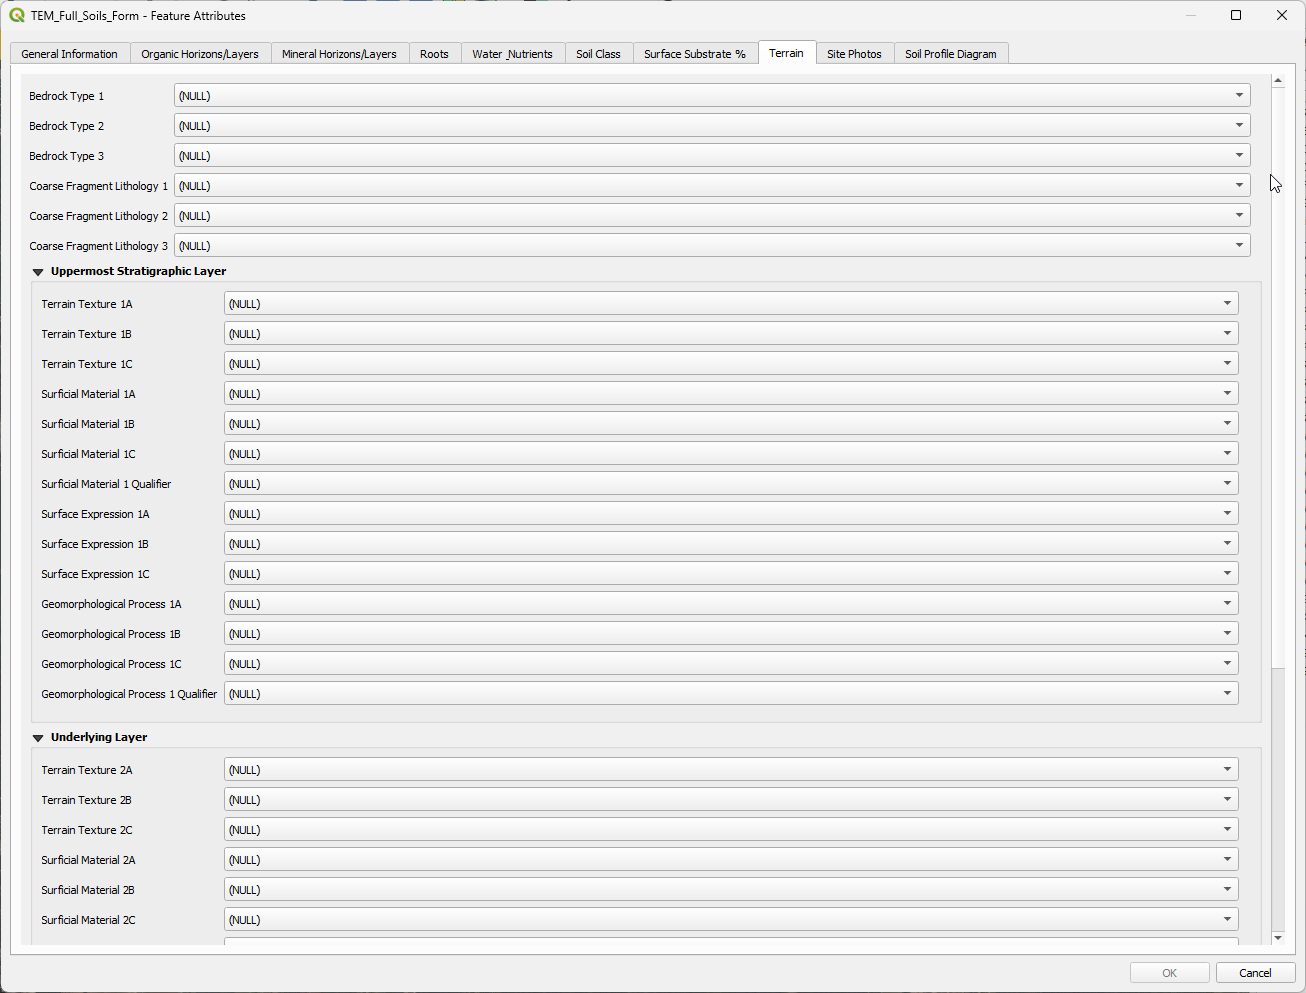
It’s not easy to digitally transform regulator-mandated paper forms. But EDI has successfully undertaken the challenge: they have developed around 15 form templates for their six practice areas (fish, wildlife, water, vegetation, construction, soils and reclamation). Some of them have close to 300 attributes, across six tables, with nested parent/child/grandchild relationships. On top of that, they’ve built their own species database in SQL with an AppSheet front end, and their custom API integration against the Mergin Maps server, which they have wired into make.com, creating their own integration solution. All of these enable them to auto-spawn projects from a Google Form and trigger custom automations.
Undoubtedly, EDI doesn’t use Mergin Maps (and other technologies) only for field data collection or as a digital replacement to paper forms. Instead, they have managed to set the efficiency standard for modern and regulator-compliant environmental management. Their experience, technical capacity and innovative approach allow them to handle hundreds of projects per year company-wide, ranging from simple site assessment for housing projects to multi-year environmental monitoring for mine permitting. This impressive number reflects the capability and growth of their IT and GIS departments.
A major driving force behind this success is EDI’s amazing GIS team, who expertly utilize Mergin Maps to set up projects effectively for navigation, precise data collection, and rigorous data QA. By seamlessly moving between QGIS and ArcGIS Pro as needed, the team has created a highly flexible and powerful workflow. This adaptable approach has not only drastically improved overall data quality, but it has also completely streamlined how they get field data directly back to the GIS team for immediate processing and analysis.
Doubling the number of projects, while on the lookout for upcoming features
Nearly 100 of EDI’s projects are currently pushed through Mergin Maps, and Logan expects that number to rise to 200 next year. Naturally, implementation of this scale is not without any friction, but they know their way around. For example, installing and properly setting up QGIS in the field can take time, which is why they’re deploying containerised QGIS via Kasm on a 10 Gb LAN next to the Mergin Maps server. Once it’s released for the Enterprise plan, the Webmaps sharing feature (already in early access) is expected to help bypass part of that friction. They are also eagerly waiting on the OGC API implementation to reach Enterprise. This way, remaining users of other GIS software could edit against the Mergin Maps server directly, avoiding round-tripping through third-party apps.
What stands out about EDI's approach is that they never waited. Rather than pausing their rollout until every feature landed, they built what they needed with the tools at hand, knowing a better solution was likely six or twelve months out and that they could jump to it when it arrived. That is only possible because everything is open: the code, the sync process, the files on disk. We are glad to see our development pace matched by theirs, and we are looking forward to the advances the next hundred projects will bring.


