


Few things taking place in urban areas are as persistent and recurrent as graffiti tagging, making it a real headache for law enforcement: It can be committed anywhere and within a few minutes, requiring only a spray can and no talent at all. The City of Vincent in Western Australia is obliged to keep its areas clean and submit a structured dataset of graffiti sites every month to the police. MNG, a geospatial company, is a GIS advisor to the city council and a reseller of Pozi, which is an Enterprise GIS solution and an established Mergin Maps partner.. For Chris Scott, General Manager for Innovation, Technology and Development at MNG, it was therefore a “no-brainer” to use Mergin Maps as the data collection tool to accurately map and record graffiti tags across the city in a way that meets the needs of both the council and the police.
Frictionless transition from manual work to Mergin Maps
Before Mergin Maps, the problem was handled through tedious manual work: staff would take photos and note addresses in a notes app, then convert the notes into a QGIS layer, look up each address and manually attach the photos. Once MNG got involved, a prototype pipeline was up and running within weeks: Mergin Maps is used for data collection and everything is synced to the council’s database. Pozi, the in-house webGIS platform of MNG, reads from that database to display the records as live web maps, which are used for viewing photos, producing heatmaps and exporting the CSV for the police. Thanks to MNG’s experience with Mergin Maps, there was no friction in the implementation. The staff were actually excited to use it, and minimal training was needed.
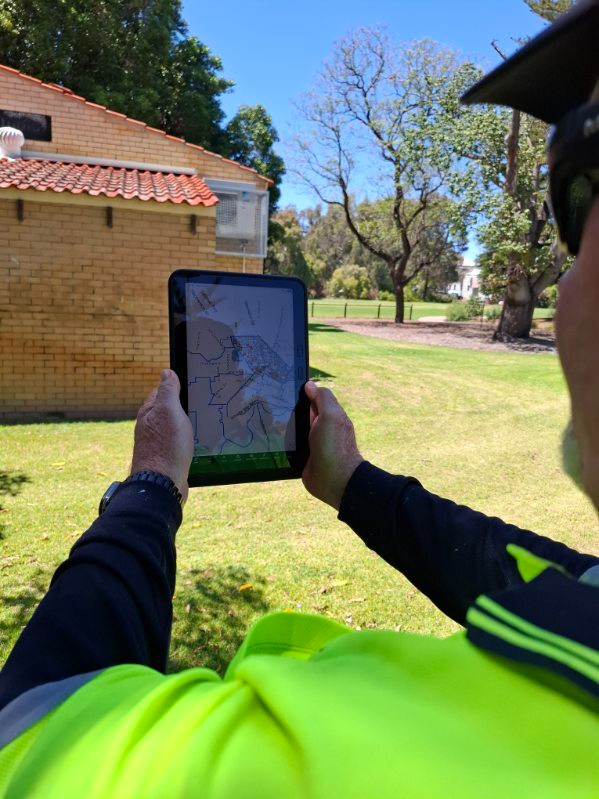
A seamless pipeline from the field to reports
So how does it all work? The form design was based on the police CSV reporting requirements. It captures location, incident severity and other incident details. Three photos are captured per record, with before-and-after shots, plus a date/time stamp. This is useful for the council as proof of cleaning in case of a resident dispute. For the staff’s convenience, everything is laid out progressively: Rule-based visibility expressions ensure that each panel appears only after the previous one is completed.
The form covers the essentials with a solid, dependable design, then goes further with purpose-built features that automatically enrich each record with valuable context. For example, the police want the closest property even when graffiti is on a pole or in the road, and the form calculates it automatically with a QGIS expression that uses lot boundaries and address data. It also includes an “is offensive” toggle: Field staff record the tag text, and if it is flagged as offensive, the record is hidden in the Pozi webmap and visible only to managers.
The data is stored in the council’s own cloud environment using DB Sync and a batch script that copies photos into it. It then syncs into Pozi for live mapping, reporting, tracking and data exporting. It also enables some interesting capabilities, such as CCTV cross-referencing: Camera locations are mapped in another layer, and when graffiti clusters nearby, the council can identify which camera may have caught it. Heatmaps, which are currently being tested, have also shown potential: they can highlight the areas and landmarks that get hit repeatedly, which the council has since treated with anti-graffiti paint.
Looking ahead: New features and new applications
Graffiti tags are now being mapped and reported efficiently. As Chris puts it, “...we’re pretty proud of the workflow and without Mergin Maps we wouldn’t have the mobile aspect”. But MNG isn’t stopping there. The potential of this project goes beyond simple data capture and reporting for law enforcement. It can also support the council’s Community Engagement department by overlaying the heatmaps with socioeconomic data and identifying correlations. This is the next piece of work for Chris. He’s also very keen on exploring AI image analysis: It could automatically transcribe offensive tags so that the inspectors don’t have to, and detect recurring styles.


